Archive
Player Aging Part 1
This will be the first post of a yet to be determined number of posts as I investigate aging curves for various stats. Gabe over at Behind the Net has already done quite a bit of work on this topic, so some of this will be a rehashing of things he’s already investigated. Our methodology differs slightly (honestly his is likely better) so the results, while similar, won’t be the same. For the first pass I chose to use the delta method with no correction for survival bias. What does this mean? I took all players that played both an age 18 and 19 season and calculated their increase/decrease in the various stats. I then calculated the same for all age pairs. Once that’s done I found a weighted average of the increases/decreases for each age pair where the weight is equal to the minimum number of games played between the two ages.
The first stat I chose to look at is pts/game. My input data is 2001-2010. The following table summarizes the results by general position
| Age | All | F | D |
|---|---|---|---|
| 18_19 | 0.140 | 0.160 | -0.108 |
| 19_20 | 0.068 | 0.072 | 0.052 |
| 20_21 | 0.026 | 0.026 | 0.023 |
| 21_22 | 0.049 | 0.050 | 0.045 |
| 22_23 | 0.023 | 0.025 | 0.018 |
| 23_24 | 0.010 | 0.022 | -0.018 |
| 24_25 | 0.002 | -0.009 | 0.024 |
| 25_26 | 0.020 | 0.027 | 0.007 |
| 26_27 | -0.022 | -0.021 | -0.023 |
| 27_28 | -0.027 | -0.039 | -0.003 |
| 28_29 | -0.024 | -0.022 | -0.028 |
| 29_30 | -0.012 | -0.030 | 0.017 |
| 30_31 | -0.038 | -0.044 | -0.028 |
| 31_32 | -0.052 | -0.069 | -0.022 |
| 32_33 | -0.045 | -0.057 | -0.021 |
| 33_34 | -0.057 | -0.062 | -0.048 |
| 34_35 | -0.067 | -0.079 | -0.046 |
| 35_36 | -0.080 | -0.083 | -0.071 |
| 36_37 | -0.058 | -0.074 | -0.022 |
| 37_38 | -0.043 | -0.042 | -0.044 |
| 38_39 | -0.089 | -0.128 | -0.002 |
| 39_40 | -0.070 | -0.073 | -0.063 |
The table shows the age pair in the first column and then the respective increase/decrease in the other three columns. These numbers seem to indicate a peak around 26. The following graph shows the same data in graphical form
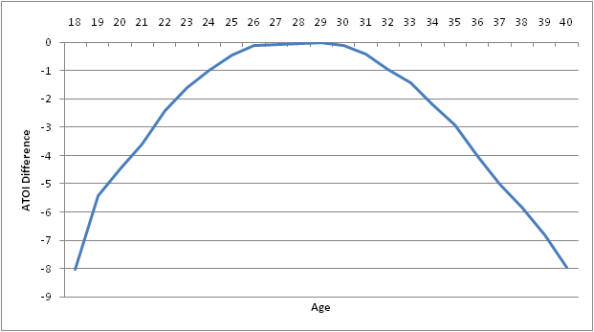
I also ran a similar analysis on average time on ice (ATOI). Here’s the table
| ATOI | |
|---|---|
| 18_19 | 2.62 |
| 19_20 | 0.93 |
| 20_21 | 0.90 |
| 21_22 | 1.18 |
| 22_23 | 0.82 |
| 23_24 | 0.59 |
| 24_25 | 0.57 |
| 25_26 | 0.32 |
| 26_27 | 0.03 |
| 27_28 | 0.05 |
| 28_29 | 0.03 |
| 29_30 | -0.10 |
| 30_31 | -0.30 |
| 31_32 | -0.54 |
| 32_33 | -0.48 |
| 33_34 | -0.78 |
| 34_35 | -0.70 |
| 35_36 | -1.13 |
| 36_37 | -0.97 |
| 37_38 | -0.83 |
| 38_39 | -0.96 |
| 39_40 | -1.16 |
and the graph
Here the positional difference was smaller (although I may graph it in a late post). Overall there appears to be a fairly flat peak between 26-30.
Next up I’d like to investigate aging of some of the more advanced stats (i.e. GVT, relative +/-, etc.)

